Operations
Overview
After setup completes, the Launcher transitions to the Operations Dashboard for ongoing management. The dashboard is organized into five tabs, with a persistent sidebar showing component status, system resources, and an event log.
Components Tab
The default view shows all running components with their lifecycle state, version, PID, and uptime. Each component has a state pipeline (Installing → Starting → Running → Stopping → Stopped) and a Restart button.
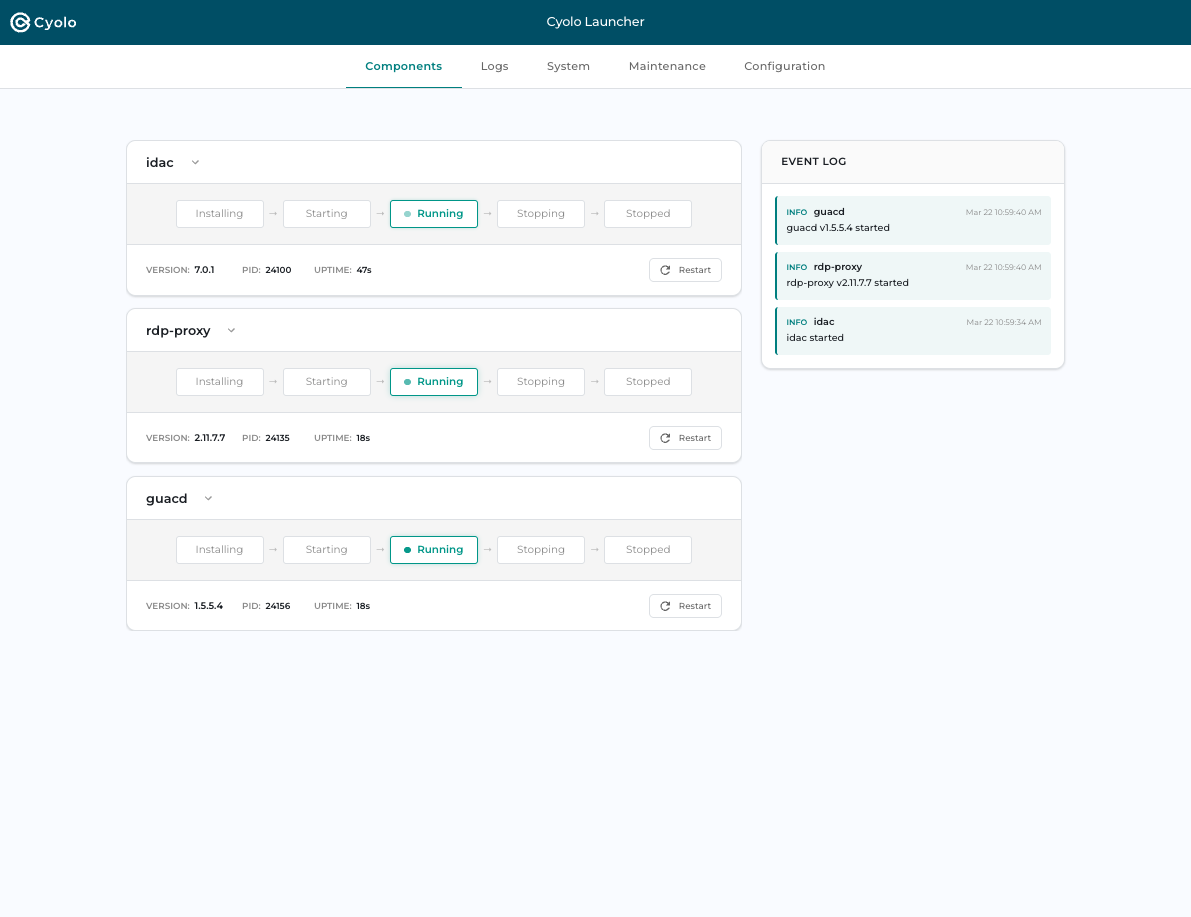
The sidebar displays:
- System Resources — Network traffic (upstream/internal), disk usage and I/O, CPU utilization, memory usage
- Event Log — Recent component events with timestamps (for example, "idac started", "rdp-proxy v2.11.7.7 started")
Component Lifecycle
| State | Meaning |
|---|---|
| Installing | Component package is being extracted and configured |
| Starting | Component process is being launched |
| Running | Component is healthy and serving traffic |
| Stopping | Component is gracefully shutting down |
| Stopped | Component is not running |
Logs Tab
A real-time log viewer that aggregates logs from all components.
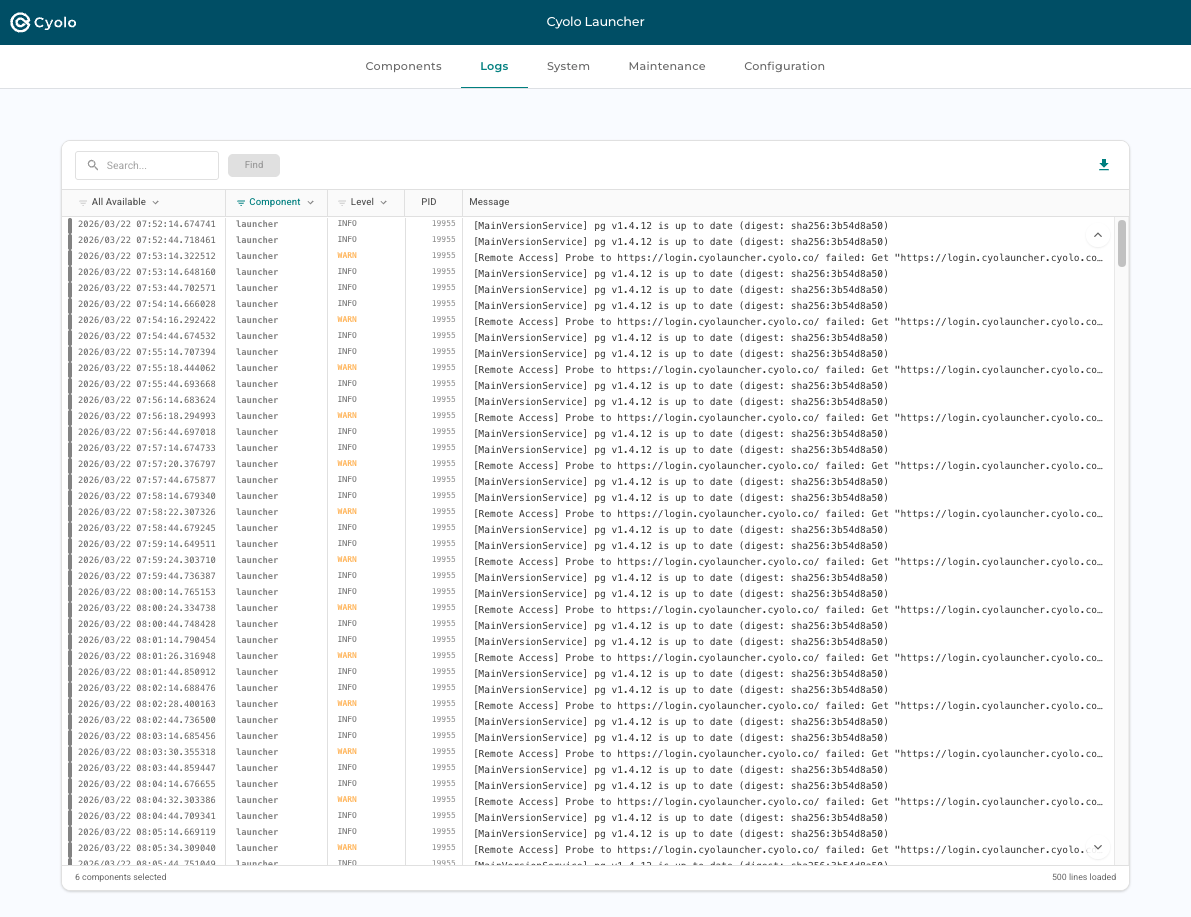
Features include:
- Search — Free-text search across all log entries
- Component filter — Show logs from specific components
- Level filter — Filter by log level (INFO, WARN, ERROR)
- Auto-scroll — "Scroll to bottom" button with hold-to-follow mode
- Download — Export logs for offline analysis
System Tab
System-level monitoring with a network traffic chart and resource summary cards.
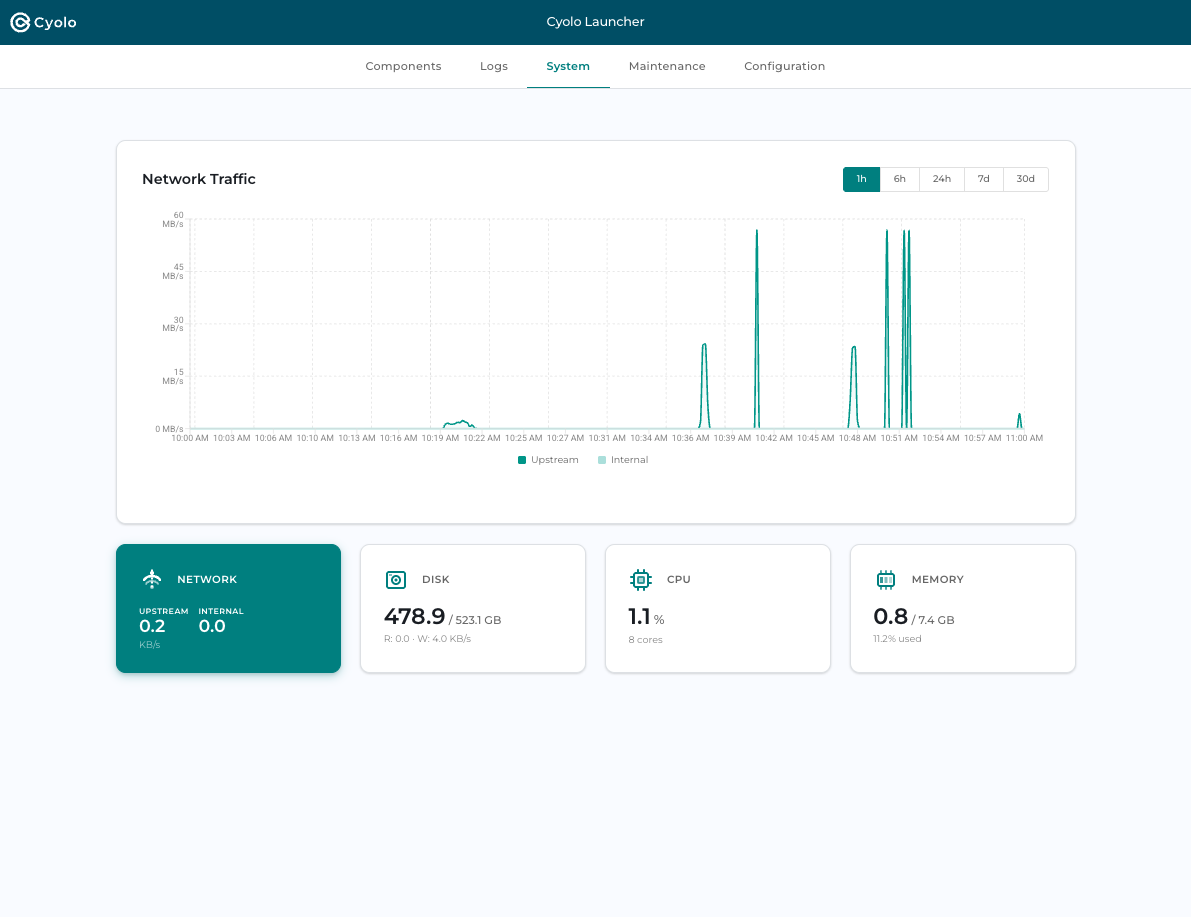
- Network Traffic chart — Time-series graph showing upstream and internal bandwidth (configurable: 1h, 6h, 24h, 7d, 30d)
- Network — Current upstream and internal throughput (KB/s or MB/s)
- Disk — Total and used disk space, plus read/write I/O rates
- CPU — Current utilization percentage and core count
- Memory — Used vs. total RAM and percentage
Maintenance Tab
Configure maintenance windows for controlled component upgrades.
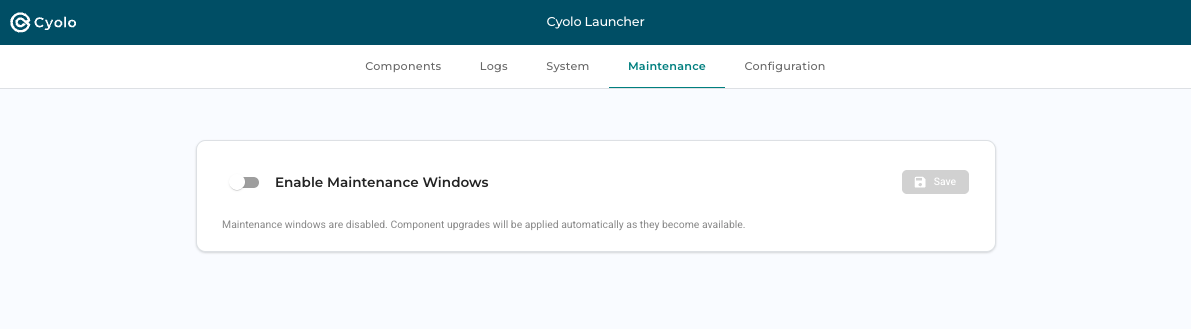
When maintenance windows are disabled (default), component upgrades are applied automatically as they become available. Enable maintenance windows to restrict upgrades to specific time slots and minimize disruption during business hours.
Configuration Tab
View and modify the component's runtime configuration without re-running the setup wizard.
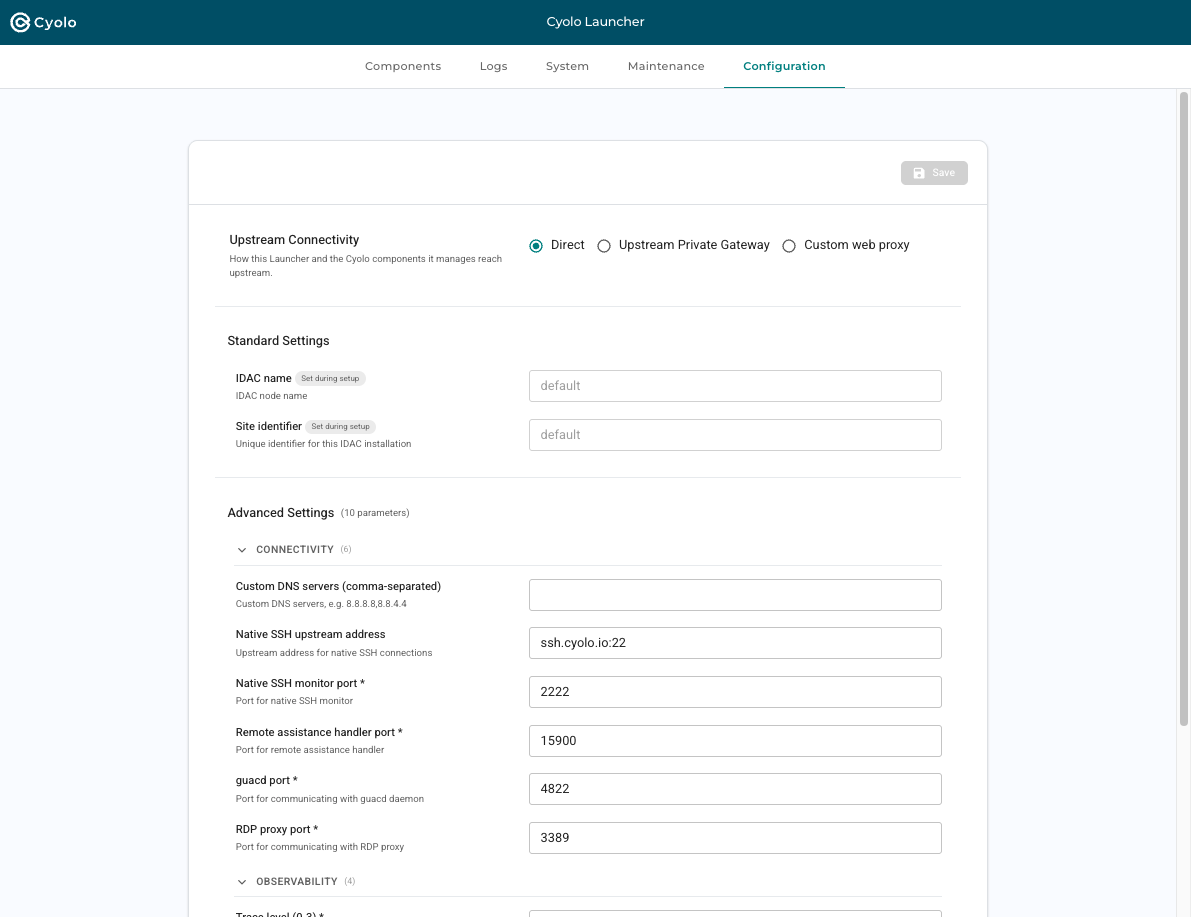
Editable settings include:
- Upstream Connectivity — Switch between Direct, Upstream Private Gateway, or Custom web proxy
- Standard Settings — IDAC name and Site identifier (read-only, set during setup)
- Advanced Settings — Connectivity (DNS, SSH, ports), observability (trace levels, profiling), and more
Changes take effect after clicking Save. Some changes may require a component restart.
Tips for Field Engineers
- Use the Logs tab with level filter set to WARN or ERROR to quickly diagnose issues
- Check the System tab when performance issues are reported. High CPU, memory, or disk I/O can indicate resource constraints
- The Event Log in the sidebar provides a quick timeline of component activity
- Use the Configuration tab to adjust connectivity or observability settings without SSH access
- Use the Restart button on components to recover from transient issues quickly