Dashboard
Overview
The Cyolo Dashboard provides a real-time overview of your organization's access activity, supervision status, and application usage.
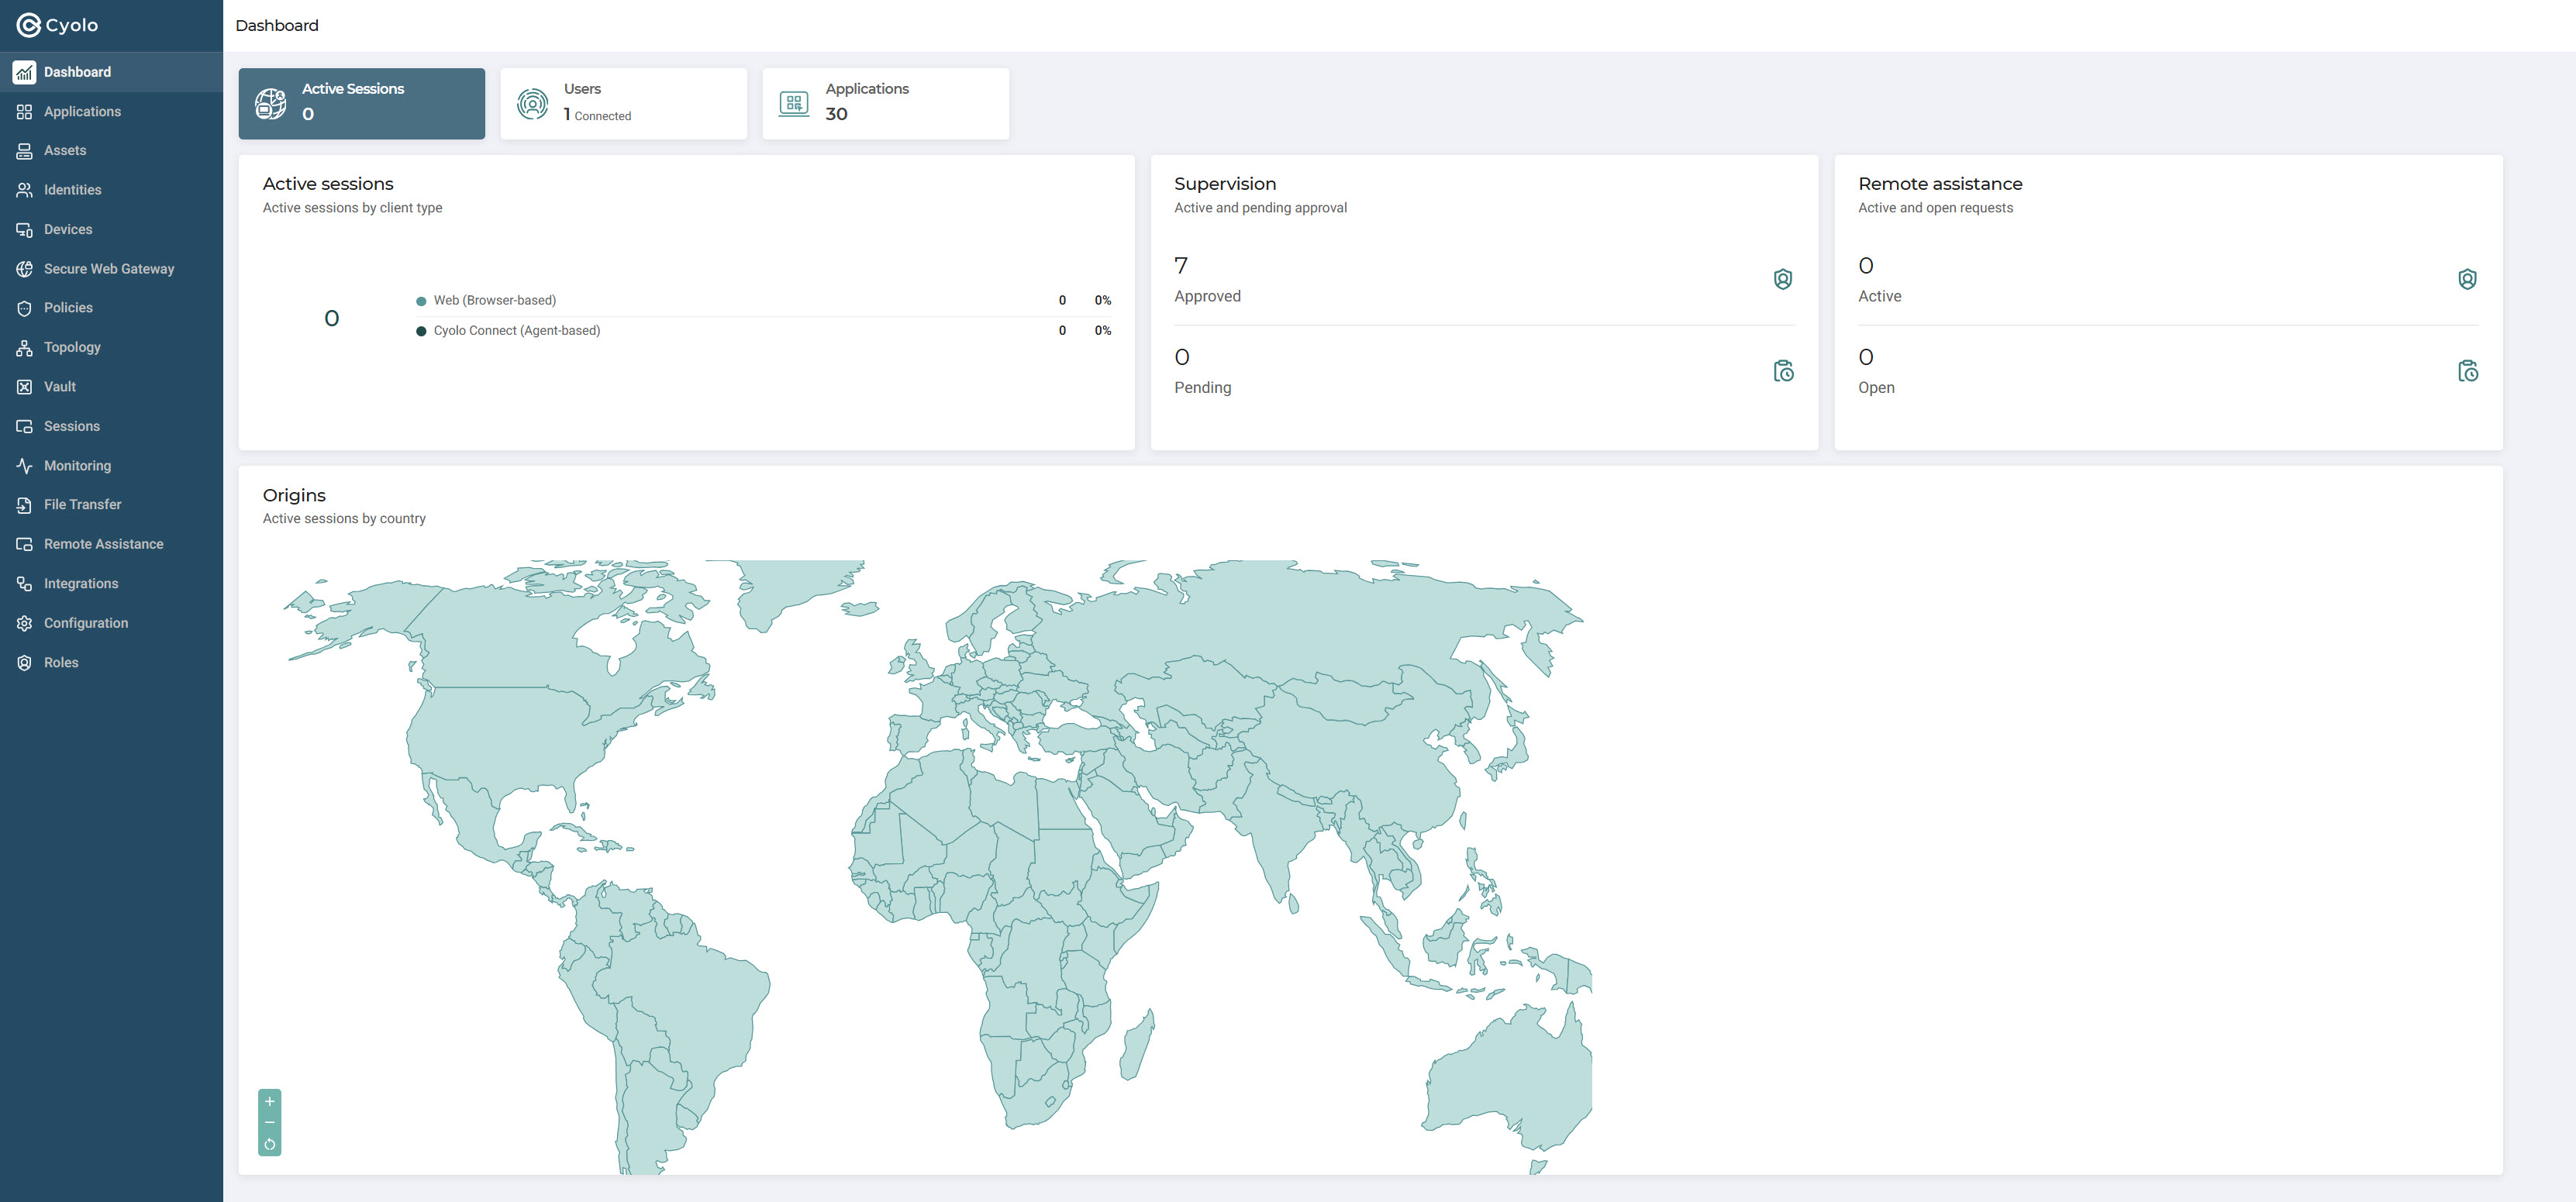
Active Sessions
The Active Sessions panel displays the number of currently active sessions in your organization, as well as details about specific session types.
Note
Sessions are counted only when they reflect active access to an organization asset. Cyolo platform activity (such as logging in to Cyolo itself) is not included in the session count.
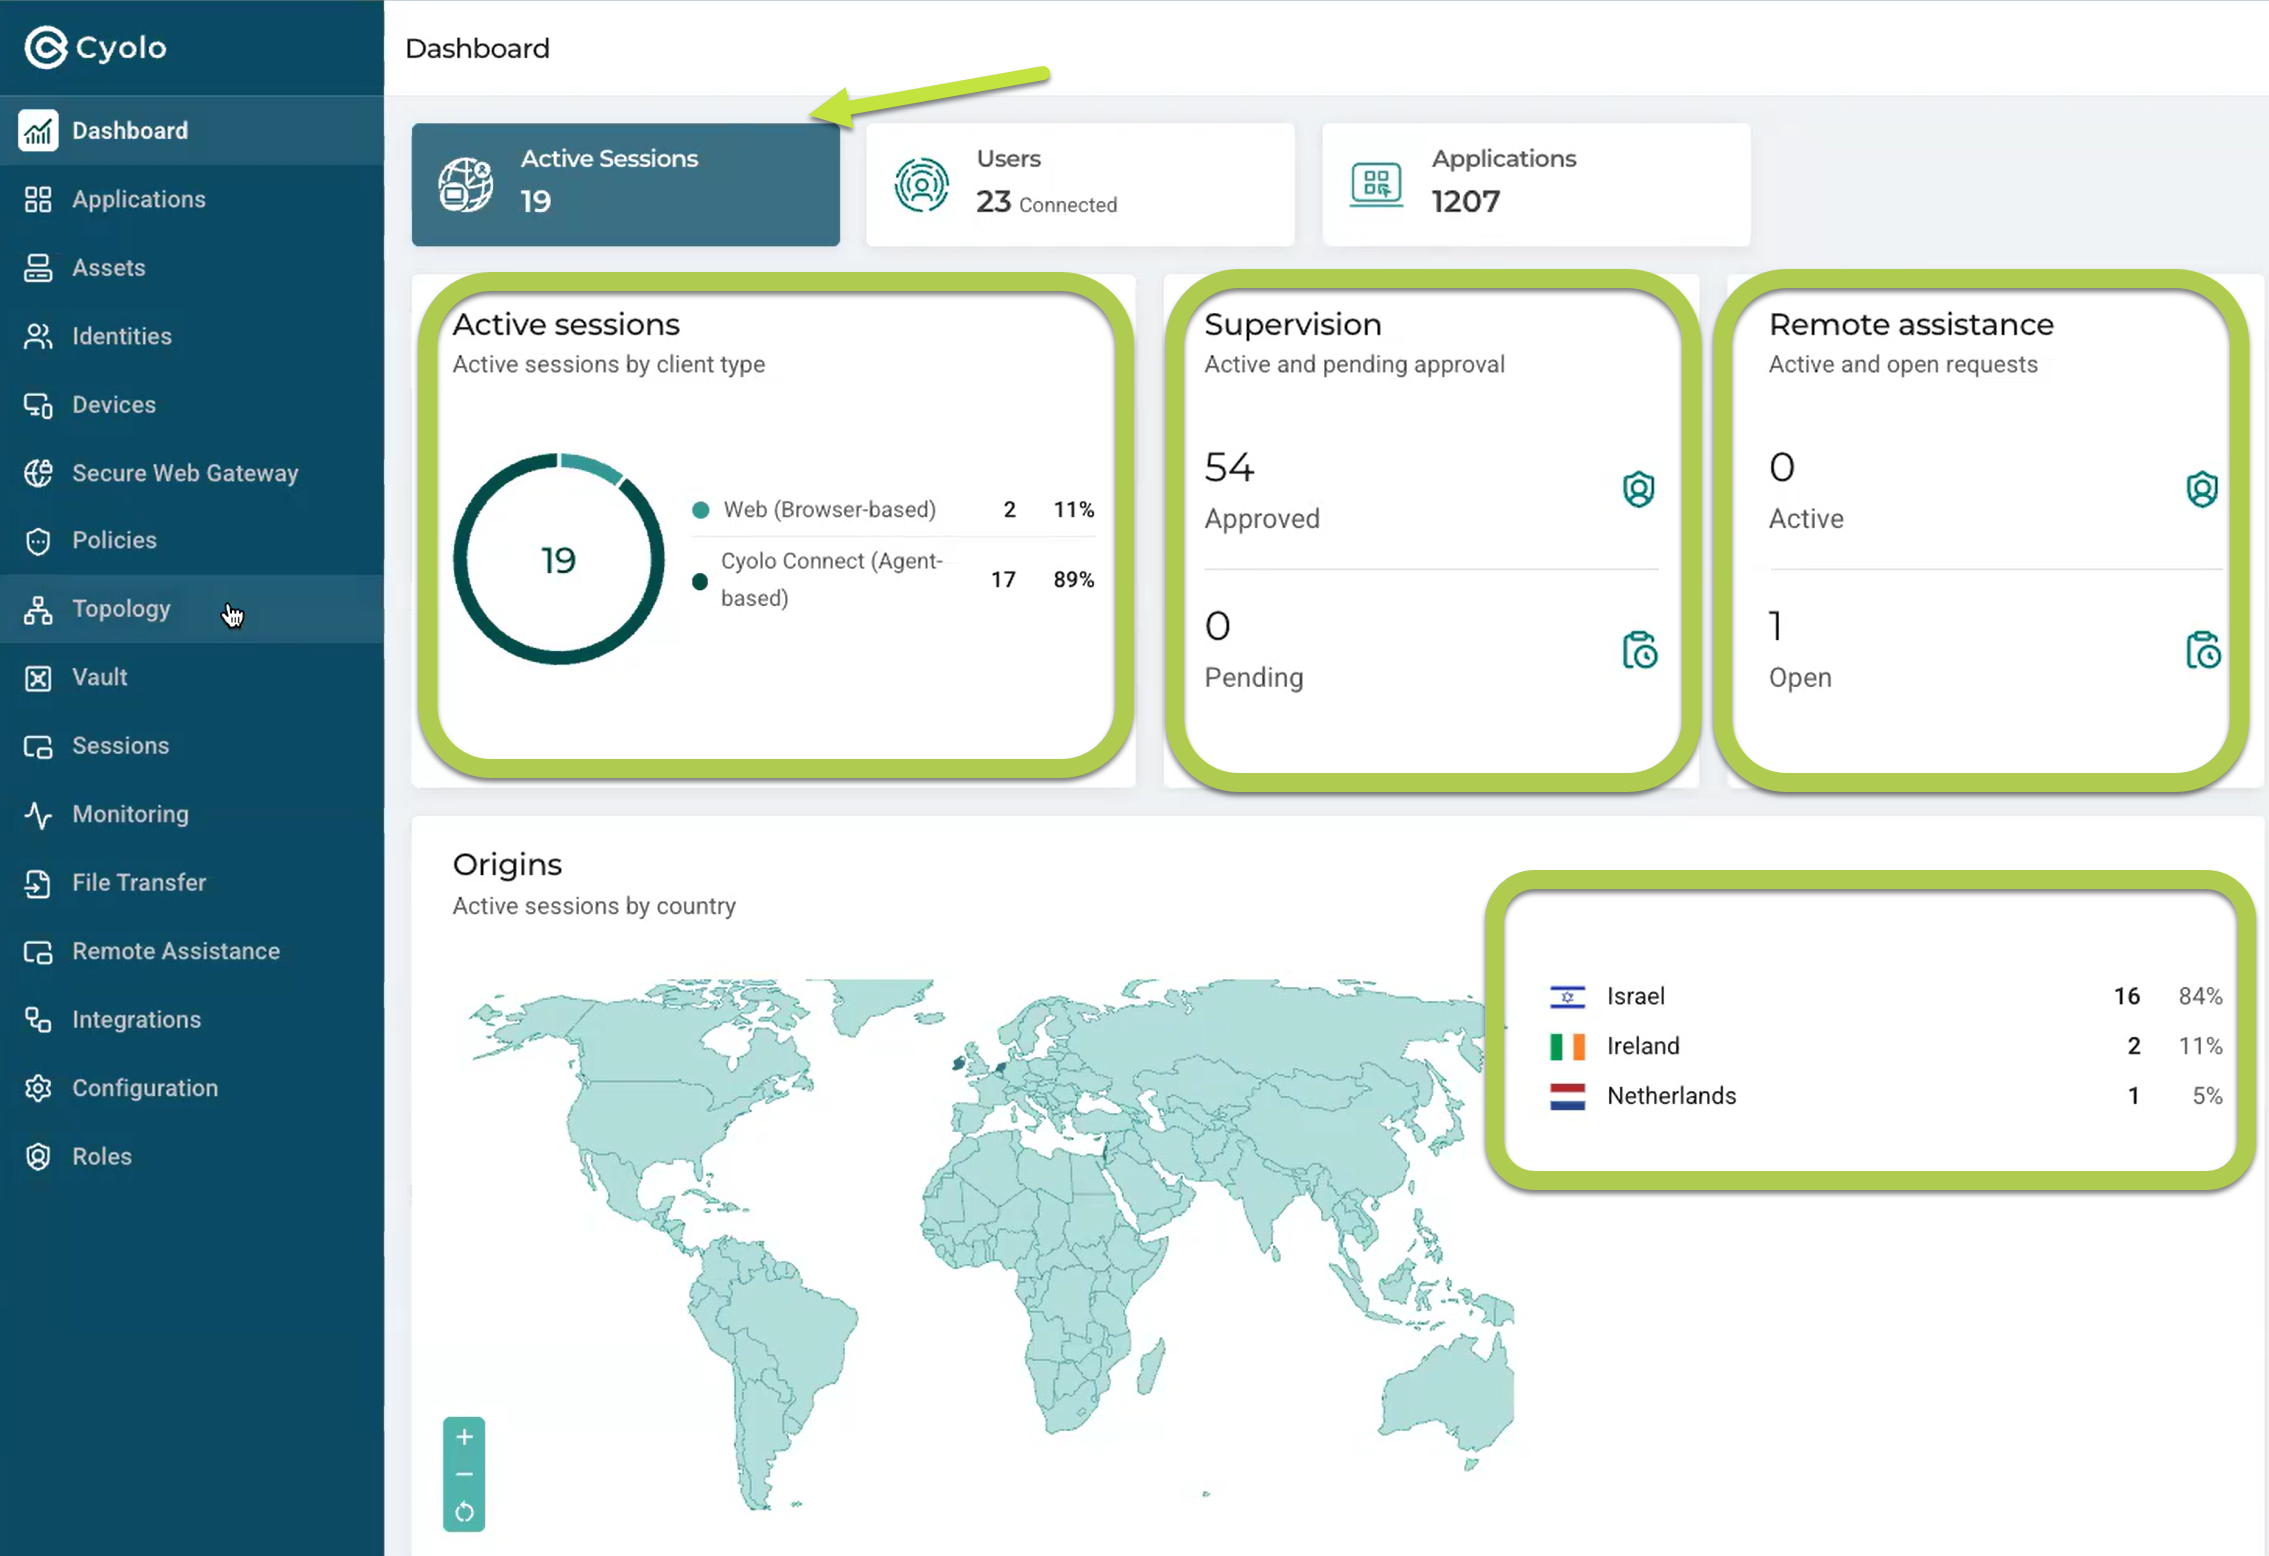
Active Sessions by Client Type
Number of Web sessions and number of Cyolo Connect sessions.
Supervision
Number of active supervised sessions, broken down by approved sessions and sessions awaiting supervisor approval. The count reflects unique users only.
Remote Assistance
Number of active and open Remote Assistance requests.
Session Origins
Number of sessions per origin location.
Users
The Users panel displays the number of unique users and groups connected to Cyolo, as well as the breakdown of groups by IdP type.
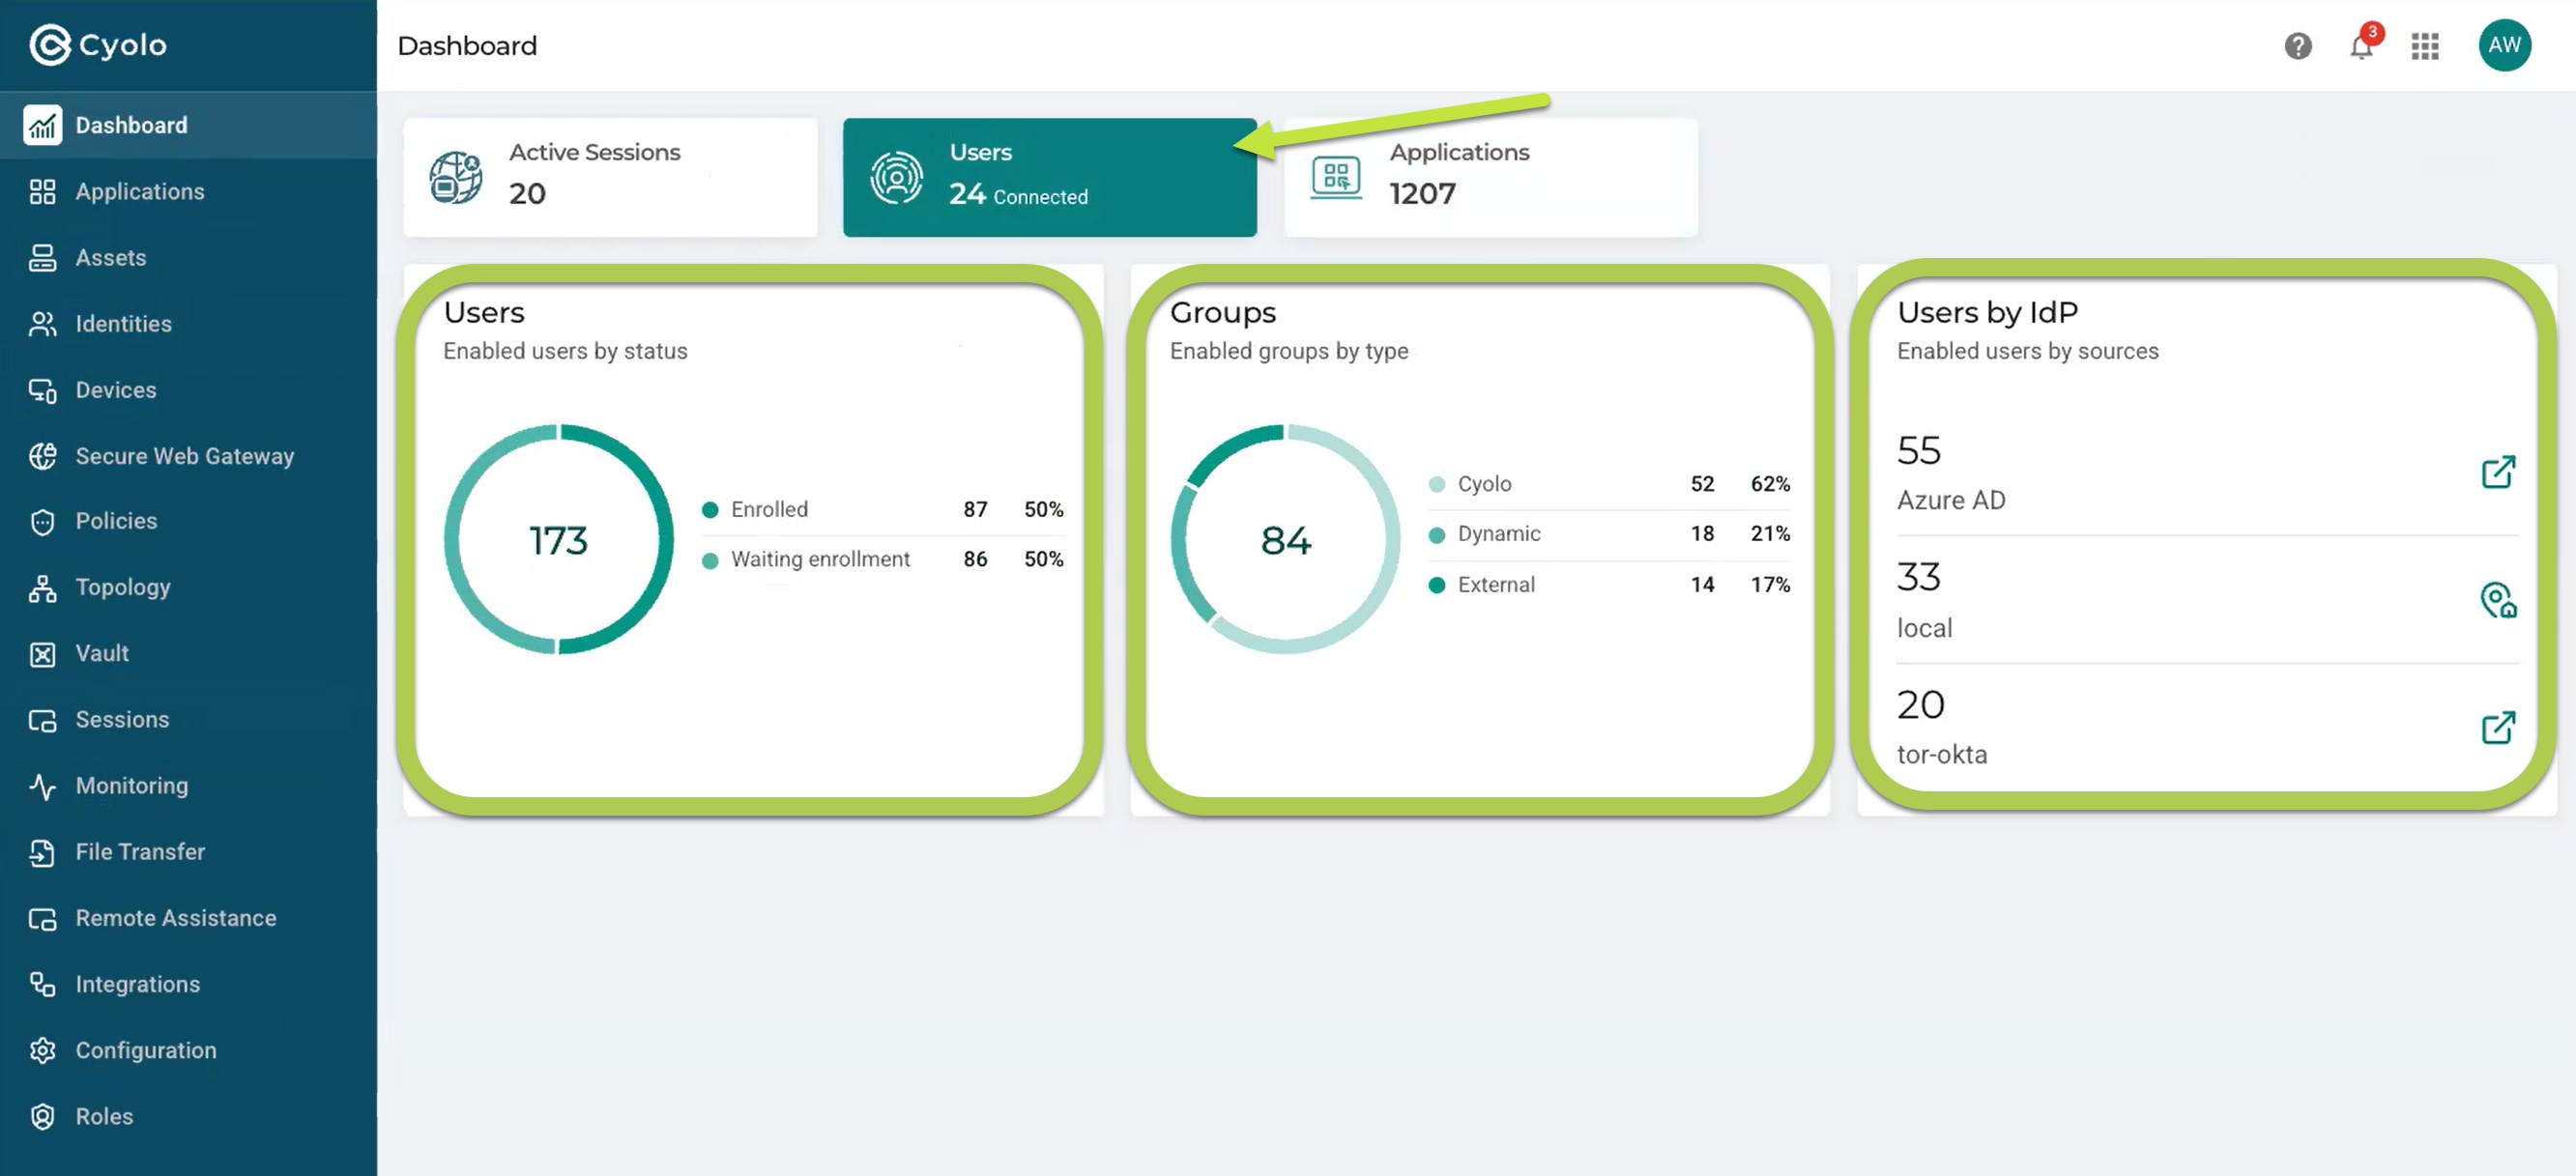
Enabled Users by Status
Number of enabled enrolled users and number of enabled users waiting for enrollment.
Groups
Number of enabled Groups by type:
- Cyolo Groups are those your organization created using Cyolo.
- External Groups are those defined in your IdP.
- Dynamic Groups are managed by Cyolo and are based on a filter applied to an External (IdP) group. They represent a subset of that External group, defined within Cyolo.
- Users by IdP - Number of users per IdP.
Applications
The Applications panel displays application counts broken down by site and protocol type.
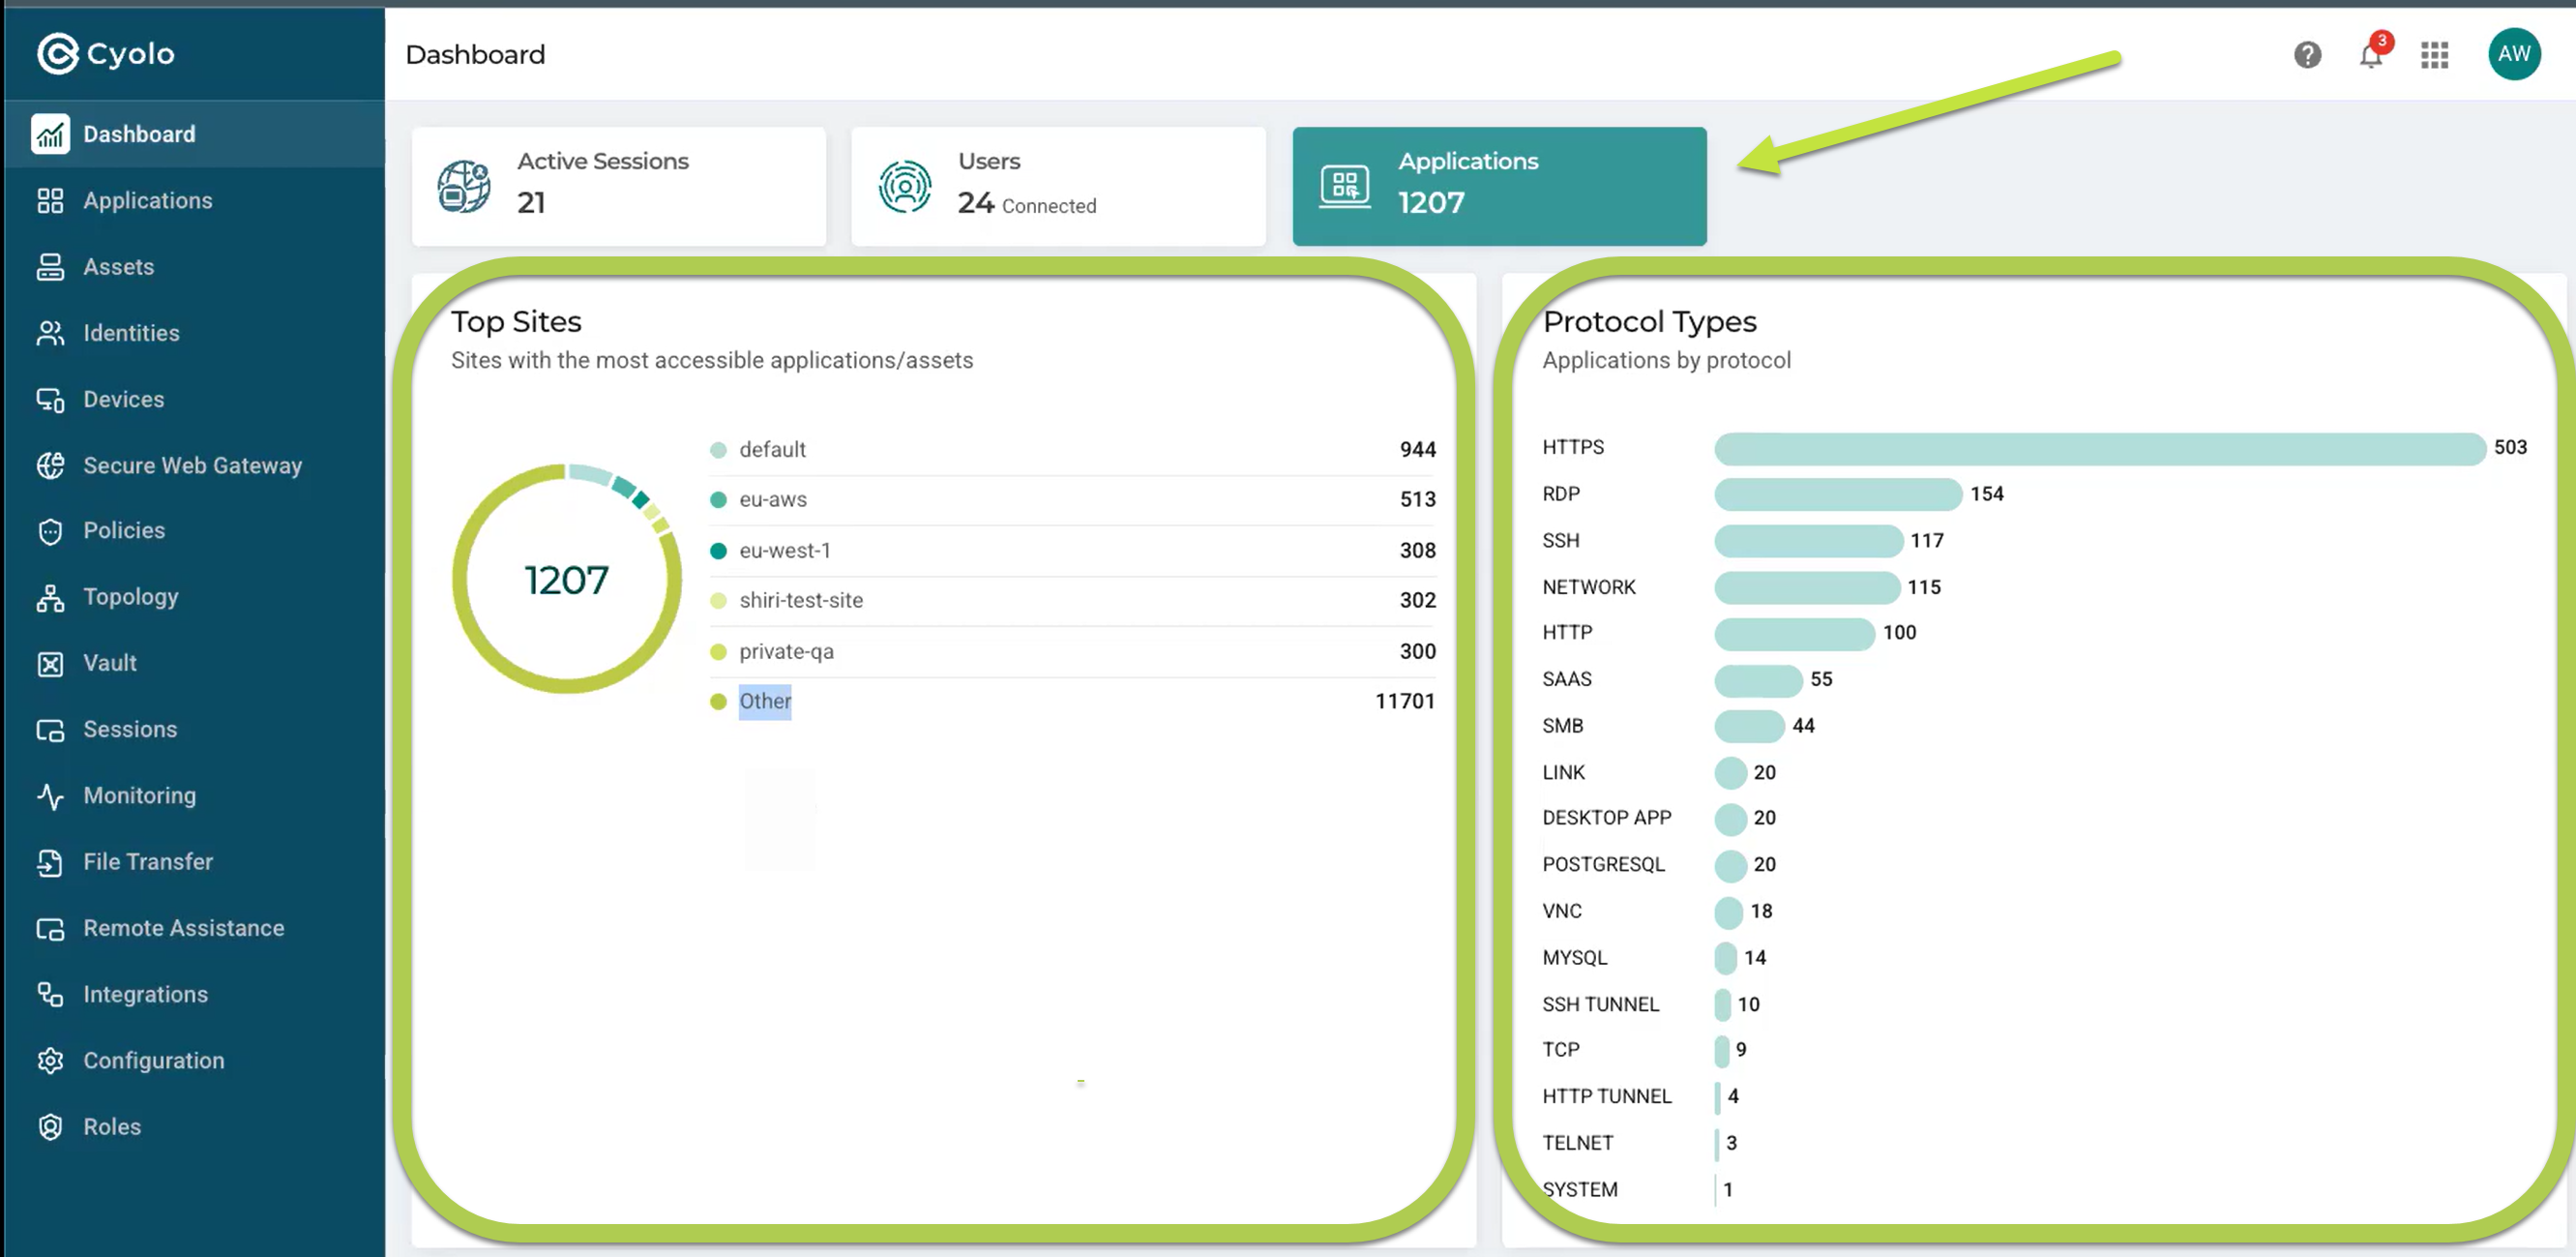
Top Sites
The total number of applications in use (1207 in the example above), and the number of applications in use at the top five active sites. The Other category represents the total number of applications accessible from sites not included in the top five (11701 in the example above.
Protocol Types
The number of active applications per protocol type.